Energy Insecurity: Why It Matters Now
BLOG POST | APRIL 28, 2020
By: Jacquie Moss, TEPRI Research Fellow
Unemployment associated with the COVID-19 pandemic will likely create a concerning new wave of energy insecurity among Texans. According to the Texas Workforce Commission (TWC), unemployment insurance (UI) claims have exceeded 900,000 in the four-week period from March 15 to April 11, 2020. For perspective, there were just over 52,000 claims in the same period last year.
This 17x jump in claims does not even accurately account for the number of Texans who have lost their livelihood. The number of people filing UI claims has overwhelmed TWC’s systems, meaning that some people who are attempting to file claims have not been counted.
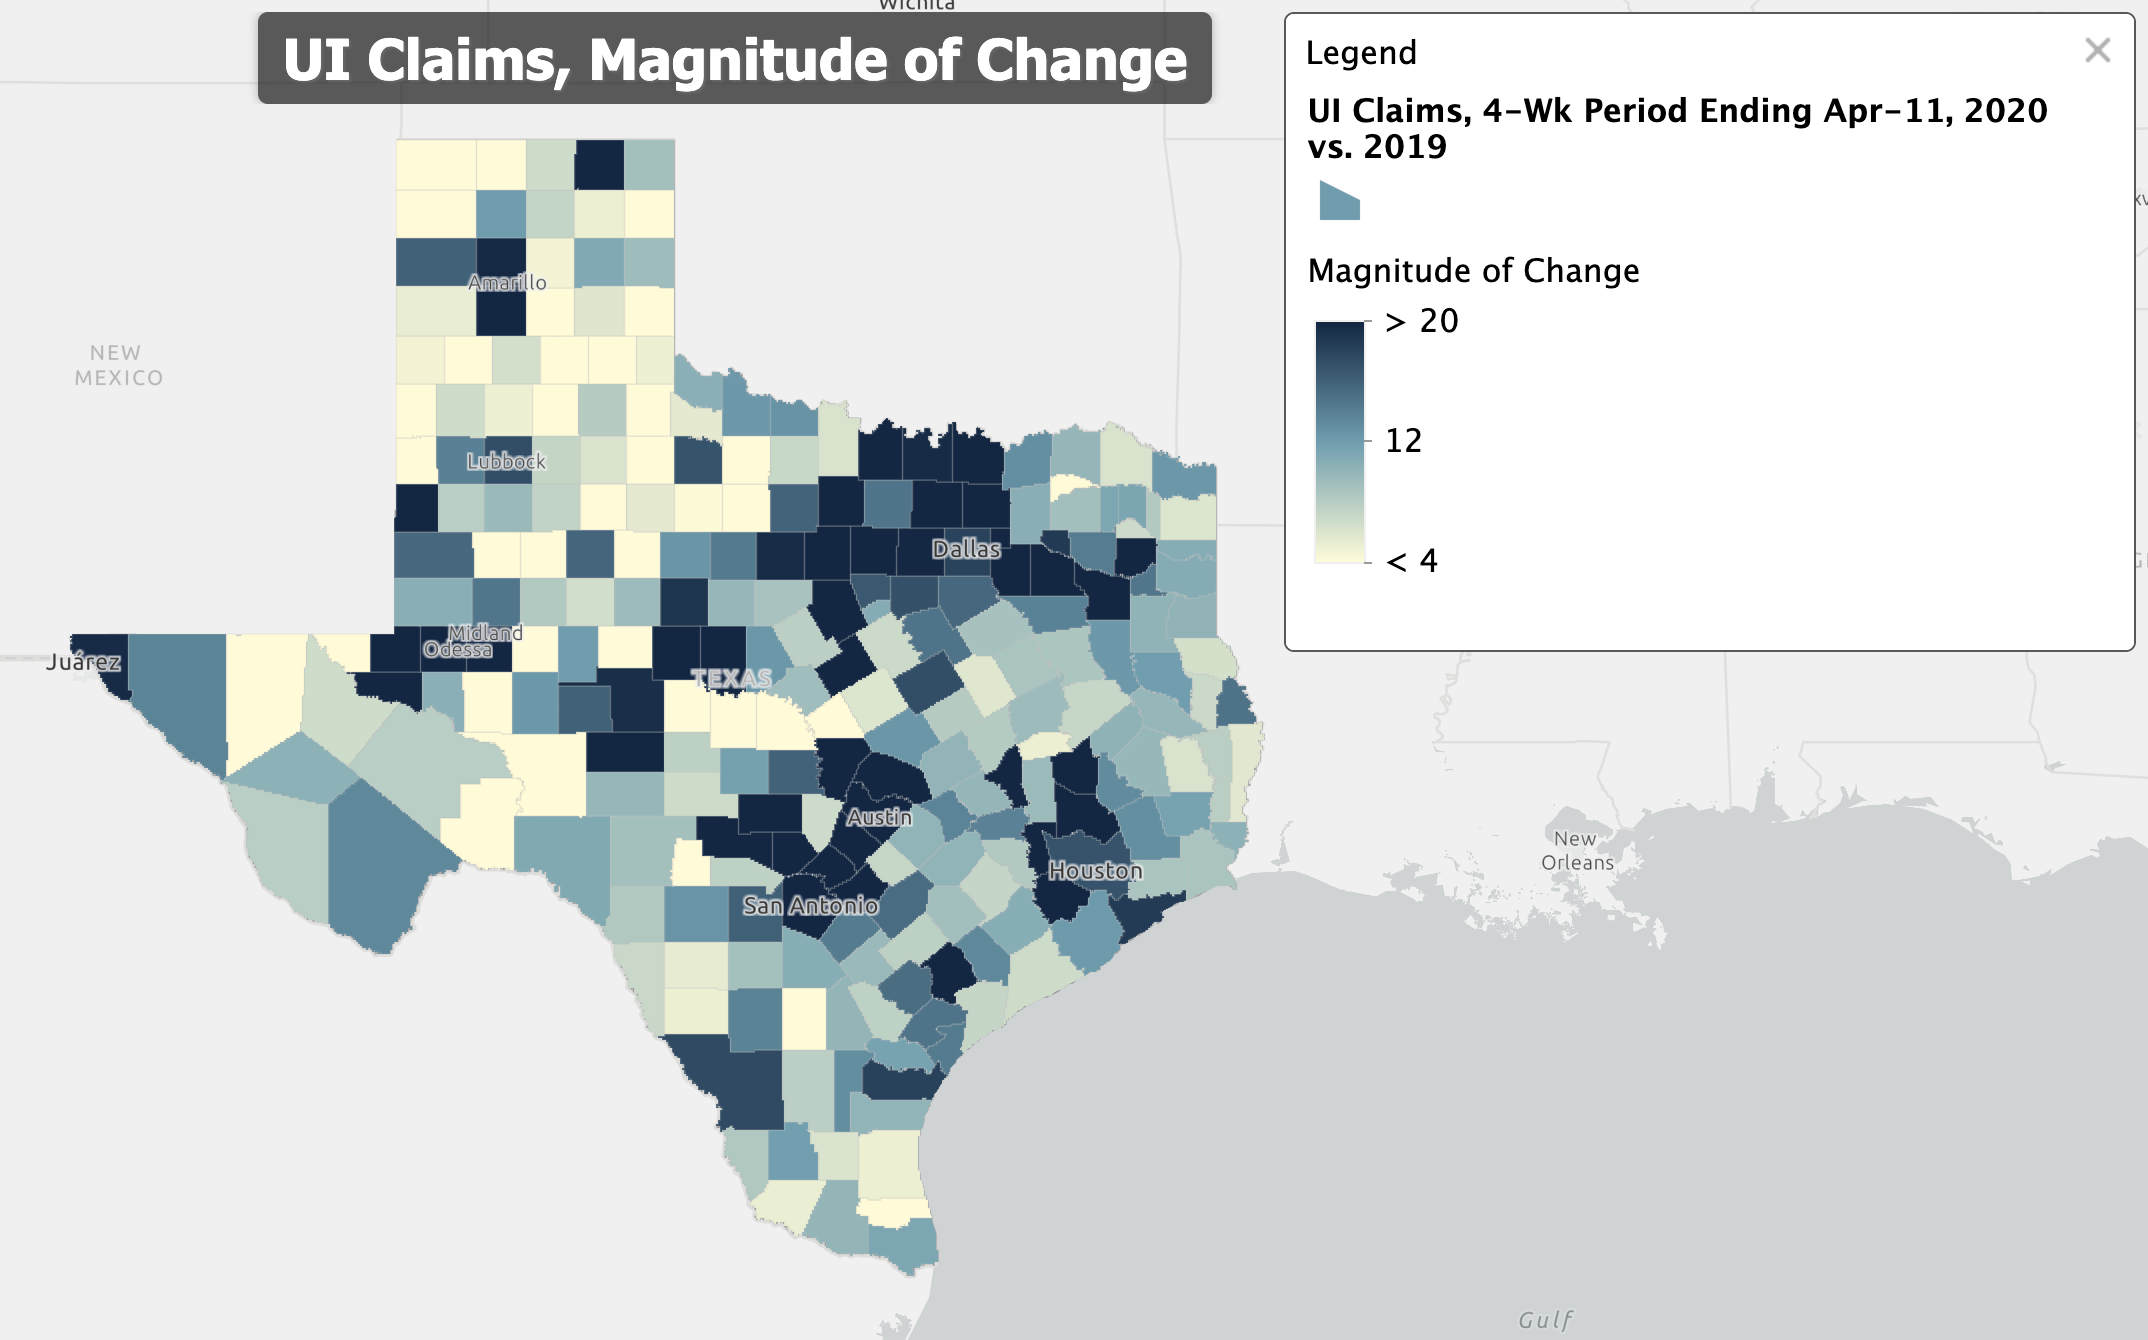
In order to understand where we might expect higher levels of energy insecurity, it is informative to look at what parts of the state are experiencing the largest increase in UI claims. Figure 1, below, summarizes claims by county and shows the magnitude increase for the aforementioned four-week period (March 15 – April 11, 2020 versus 2019).

Representing 41% of Texas households (pre-pandemic), low-income energy consumers spend a disproportionate amount of household income on energy. This concept of the percentage of household income spent on energy is often referred to as “energy burden.” In Texas, the average energy burden for low-income households is 9% compared to 2% for non low-income households. These figures are determined using data from the Department of Energy’s Low-Income Energy Affordability Data (LEAD) Tool (2019). We define low-income households as those earning 0-80% of area median income.
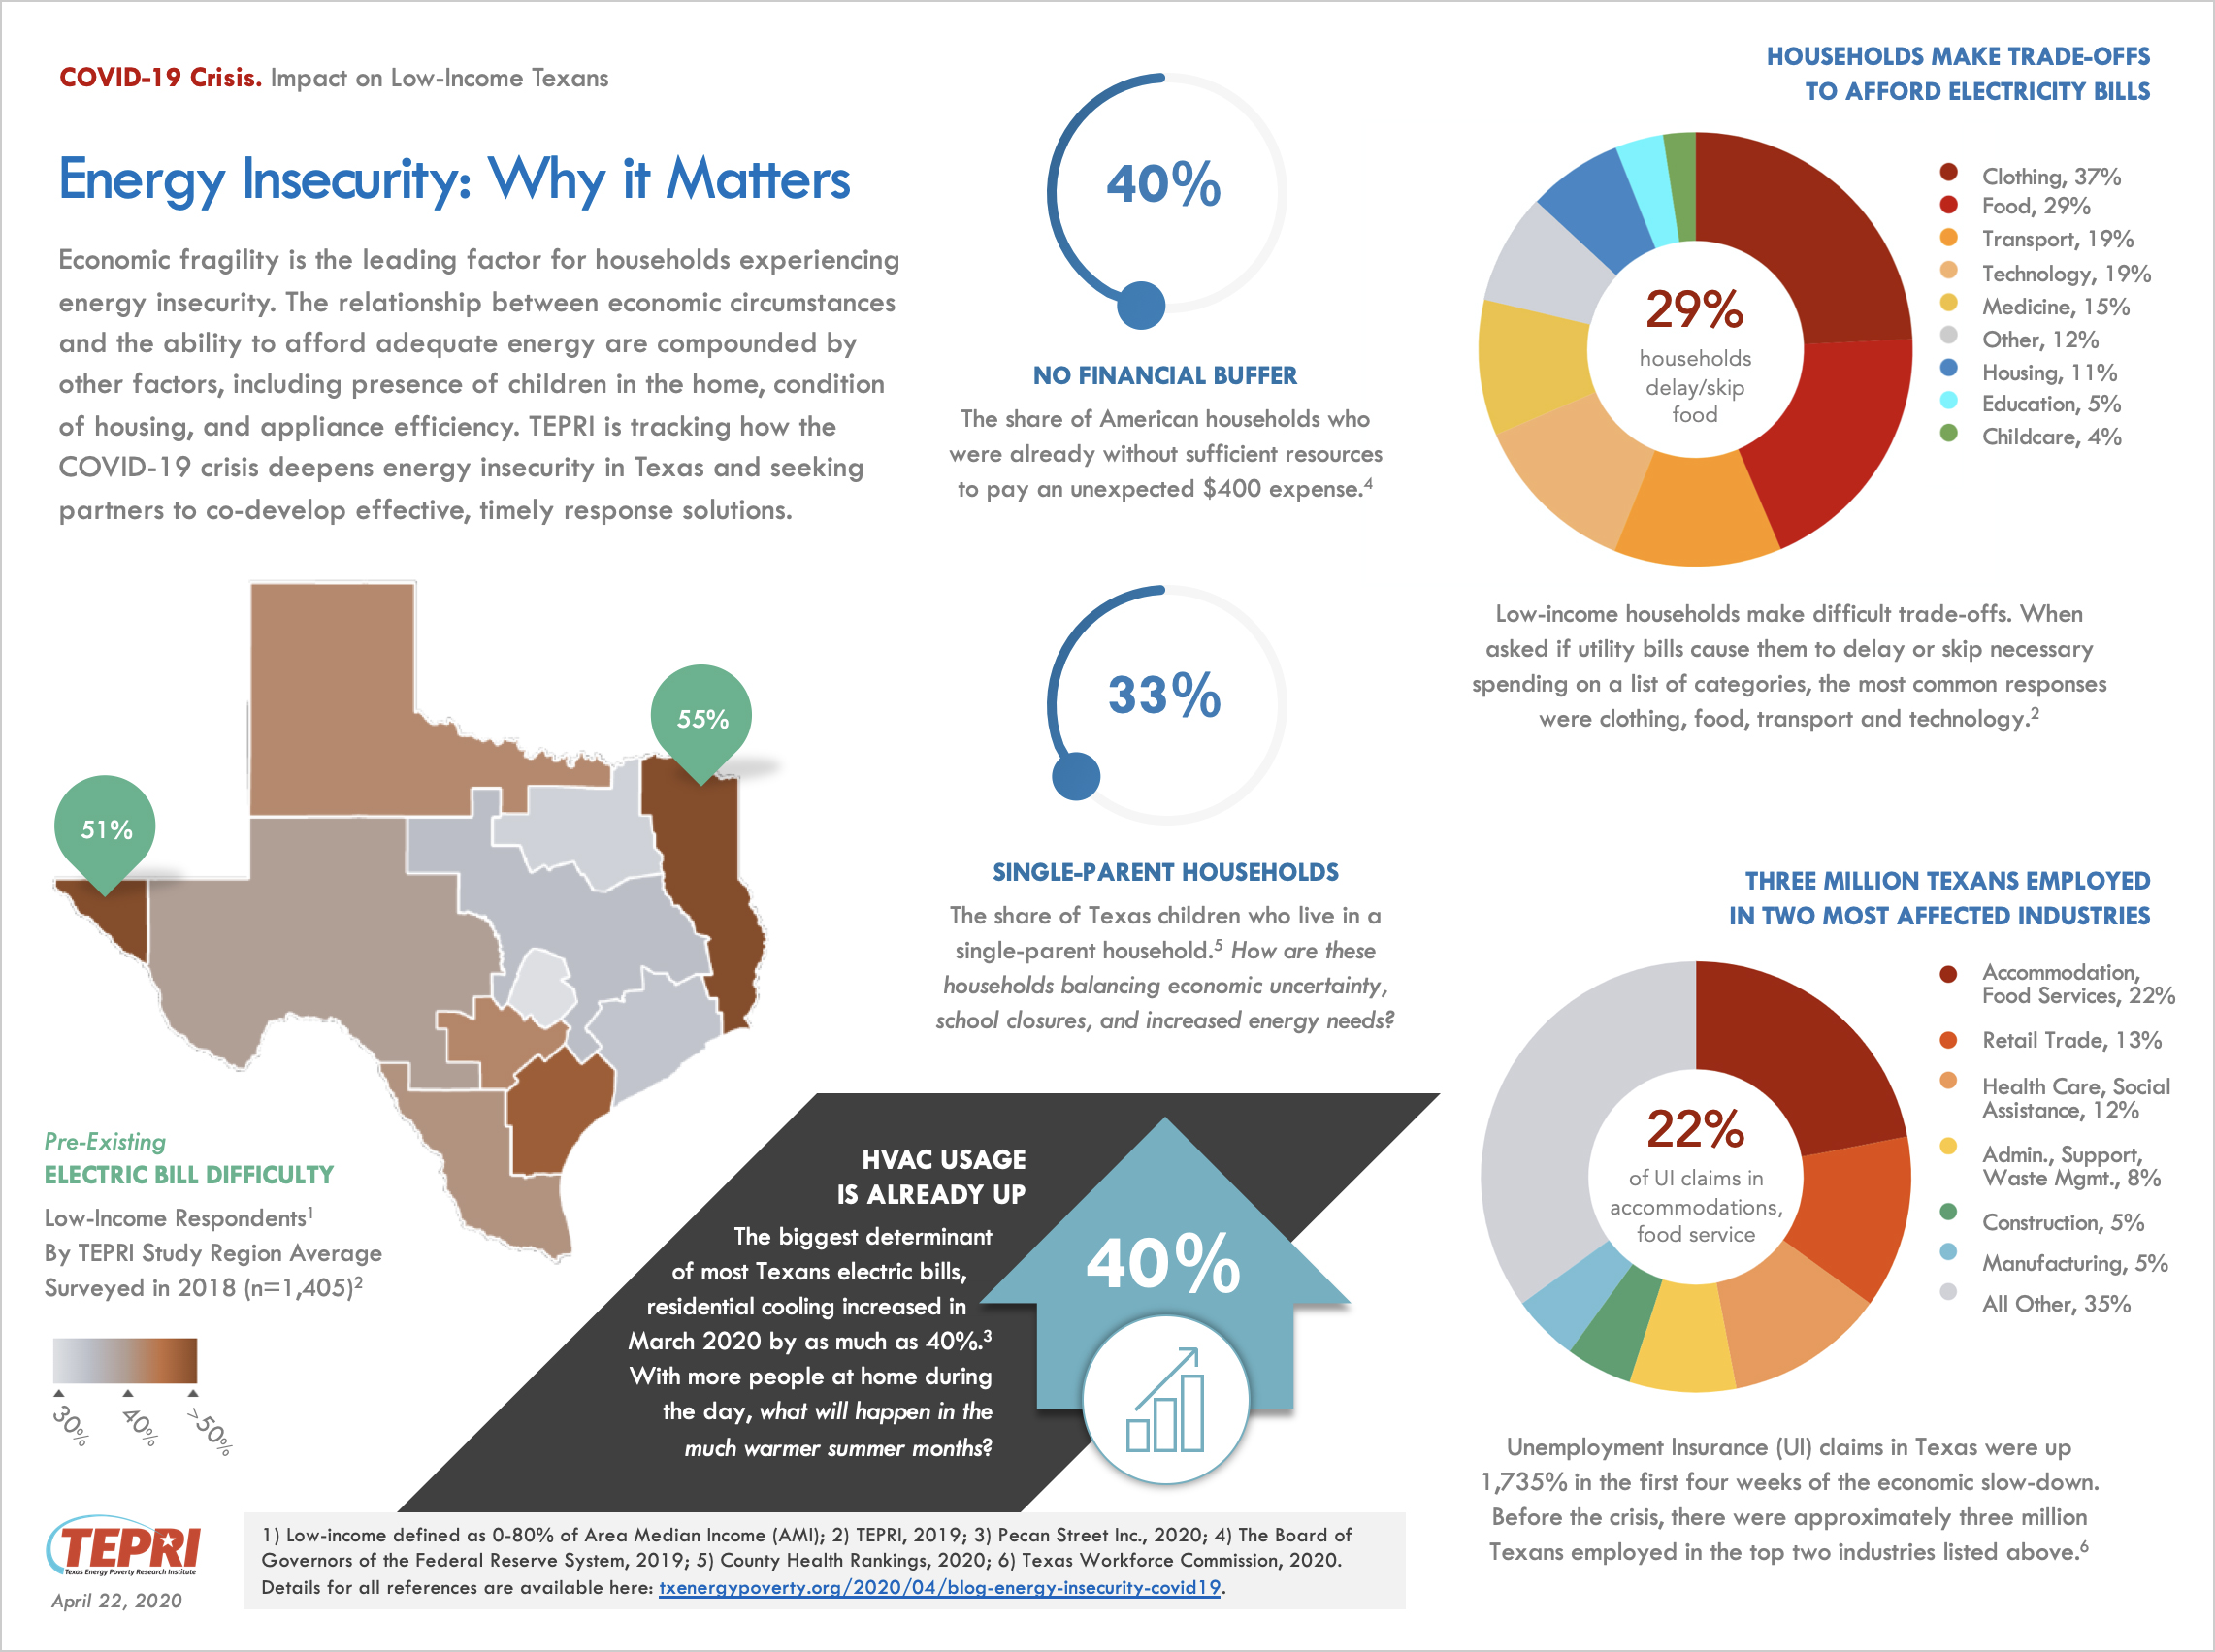
Before this pandemic, we found that a large percentage of low-income households across the state experienced difficulty paying their electric bills (30-55% of low-income households depending on the region). Additionally, we found that households make difficult trade-offs to afford their electricity bills, with 29% of survey respondents saying that they delay or skip spending on food. These findings are included in the infographic shown below (Figure 2).

While there were notable regional differences as to what contributed to difficulty paying electricity bills, the factors that were most commonly shared statewide were these: difficulty with other bills, stress and sickness related to one’s home temperature, presence of children in the home, poor quality of housing, and household members with disabilities. Many more households have members who are spending more time at home — either to care for children, because of losing a job, or because of working-from-home. These changes will show up in the household’s electricity usage, and likewise, in the difficulty and stress related to paying those bills.
The team at Pecan Street, Inc. recently reported on how COVID-19 is changing residential energy use. Pecan Street has monitored hundreds of homes in its research network for almost a decade. Closely analyzing appliance-level data, the team discovered that refrigerators and HVACs are seeing the biggest increases in usage since the onset of this crisis. Cooling demand increased by as much as 40% in March compared with average from the previous three years. Based on these findings, we want to closely watch what happens in the summer months as temperatures rise for economically-vulnerable customers who generally run less efficient refrigerators and heating/cooling systems.
Many Americans have no financial buffer. As reported by the Board of Governors of the Federal Reserve System, almost 40% of Americans do not have the resources to afford an unexpected $400 expense. With little cushion to absorb the economic shock of the COVID-19 crisis, many households are turning to food banks, community action agencies, and charitable organizations for help.
There are bill assistance resources in place for most electric customers across the state. We wrote previously about the federal CARES Act and PUC of Texas order on suspension of disconnections. These are important steps to address the economic impact for vulnerable households. However, in many cases, payments are deferred but not forgiven. This crisis is likely to leave many low-income households with a very deep economic burden that includes several months worth of energy bills, among other deferred bills, at some point in the future.
This problem presents an opportunity to plan now for long-term solutions to help reduce the economic burden of residential energy use. Solutions may include increased deployment of energy efficiency and other distributed energy resources (DERs), such as community solar and smart home technologies, as well as creating new pathways for participation in the advanced energy economy.
Please download, share, print, and discuss our “Energy Insecurity: Why It Matters” infographic. Let us know your questions, ideas, and provocations. We will continue to track the impact of this crisis, and we welcome the opportunity to connect with partners to co-develop effective, timely solutions.
Sources:
Bureau of Economic Analysis (BEA), 2018: Total Full-Time and Part-Time Employment by NAICS Industry (CAEMP25N). Retrieved online at: https://www.bea.gov/data/employment/employment-by-industry
County Health Rankings, 2020: 2020 County Health Rankings Texas Data – v1_0 (sheet: Ranked Measure Data, columns: “# Single-Parent Households” out of “# Households.”), collaboration between the Robert Wood Johnson Foundation and the University of Wisconsin Population Health Institute. Available online at: https://www.countyhealthrankings.org/app/texas/2020/overview
LEAD Tool, 2019: U.S. Department of Energy, Low-Income Energy Affordability Data (LEAD) Tool, July 2019. LEAD Tool data comes primarily from the U.S. Census Bureau’s American Community Survey 2016 Public Use Microdata Samples (5-Year Average, 2012-2016) and are calibrated to the U.S. Energy Information Administration’s electric utility (Survey Form-861) and natural gas utility (Survey Form-176) data. Retrieved online at: https://www.energy.gov/eere/slsc/maps/lead-tool
Pecan Street Inc, 2020: Hinson, Scott., COVID-19 is Changing Residential Electricity Demand, April 2020. Available online at: https://www.renewableenergyworld.com/2020/04/09/covid-19-is-changing-residential-electricity-demand/#gref
TEPRI, 2019: Harmon, Dana and Jacquie Moss. Low-Income Community Profile Series: Texas Overview, June 2019. Available online at: https://tepri.org/2019/06/licp-texas-overview/
Texas Workforce Commission, 2020: Texas UI Claims Leading Up to the Week Ending 4/11/2020. Retrieved online at: https://www.twc.texas.gov/news/unemployment-claims-numbers#claimsByCounty
The Board of Governors of the Federal Reserve System, 2019: Report on the Economic Well-Being of U.S. Households in 2018, May 2019. Available online at: https://www.federalreserve.gov/publications/files/2018-report-economic-well-being-us-households-201905.pdf

