TEPRI has been expanding our network of energy stakeholders, decision makers, and community leaders to bring forth new perspectives around energy system improvements that allow us to tailor strategies for unique regional challenges.
On top of existing concerns, energy costs are on the rise in Texas. Residential energy rates in the competitive market are up 70% year over year, averaging over 18 cents per kilowatt hour. For the average family, these increases amount to roughly $80 more on their monthly bills – an incredibly tough prospect during a period of high inflation, especially for lower-income families where income was already tight pre-pandemic.
Far too many households endure disproportionately high energy costs, face environmental risks, and are ladened with high exposure to harmful emissions. TEPRI, in collaboration with the Southeast Energy Efficiency Alliance (SEEA), co-developed the Energy Equity Inspector – a geospatial tool to help identify and highlight the depth of energy burdens and environmental impacts in communities in the southeastern United States. This tool illuminated the alarming scale of unaffordable energy and environmental threats across Texas.
Regional Snapshot
Utilizing the Energy Equity Inspector, TEPRI has worked to identify the communities where disproportionate impacts of energy burden and risks of environmental vulnerability on low and moderate income (LMI) households are in Texas. South Texas – an area stretching roughly from Del Rio to Corpus Christi and south to the US-Mexico border – stands out as an area of particular interest for future efforts.
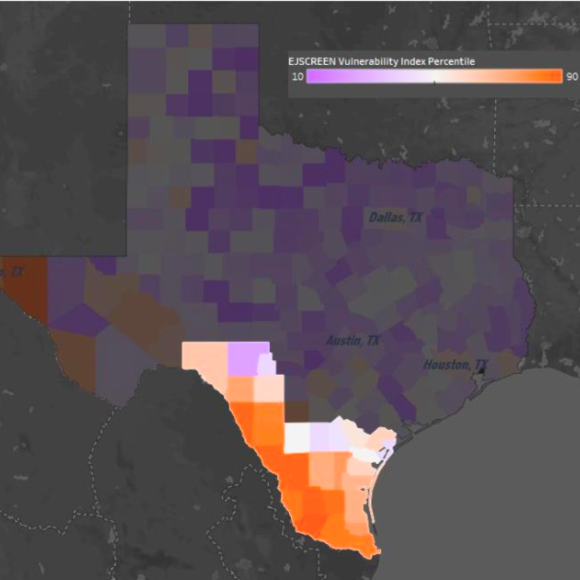
South Texas’ higher EJSCREEN vulnerability indices – combined with other important indicators such as low-income energy burdens, poverty, home age and type, and area median income (AMI) – highlight the critical need for energy efficiency and clean energy investments in the region. TEPRI is working to grow our relationships with community based organizations in the region to better understand the challenges facing different communities in this area and to identify opportunities for mission alignment and cross collaboration.
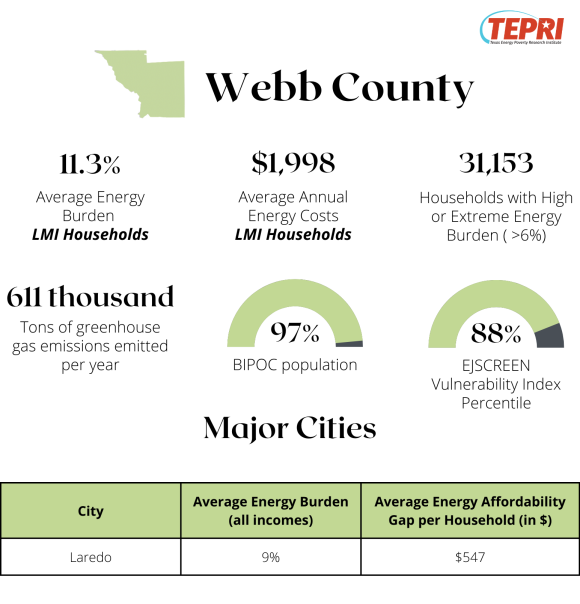
Community Spotlights
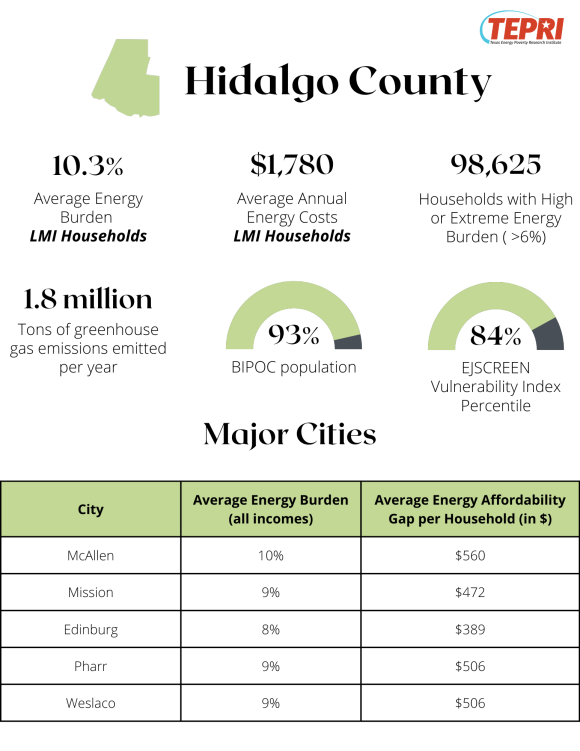
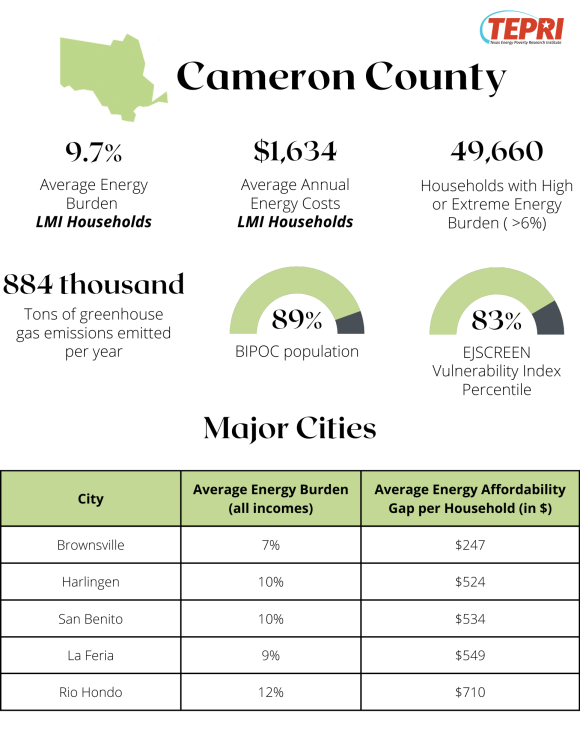
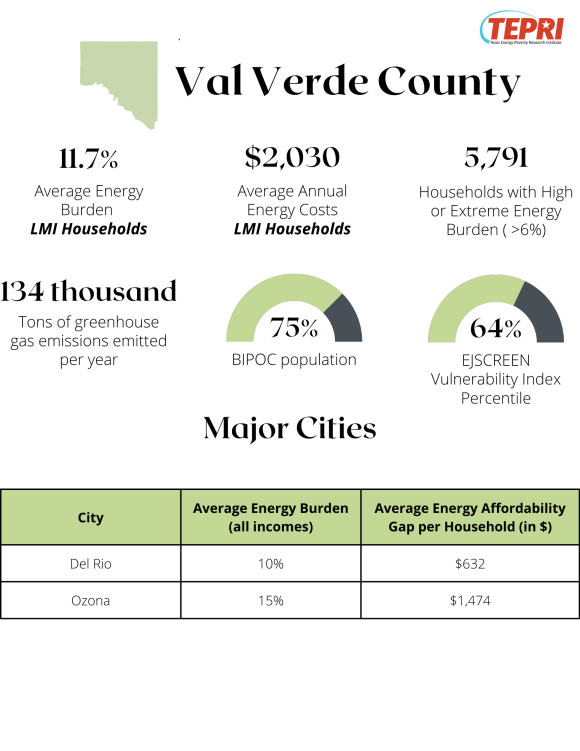
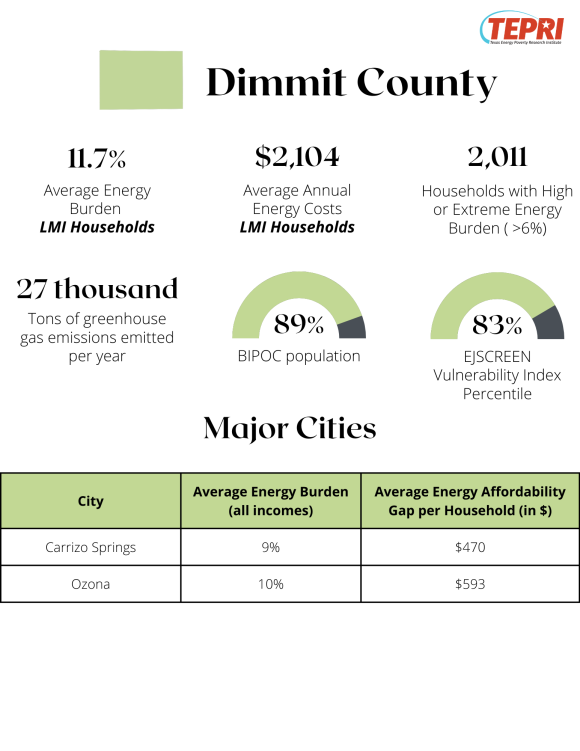
The following infographics highlight several counties in South Texas to help paint a clearer picture of the state of energy affordability in the region. For our purposes, we have chosen to highlight several urban and rural areas across the region to illustrate the variety of challenges across communities. Each graphic depicts several key energy affordability and environmental indicators and highlights the state of affordability in the most populous cities in each county (where data was available).
For your reference, we have provided definitions to the terms used in the infographics below:
- LMI – Low-to-moderate income
- Energy burden – the percentage of household income spent on energy costs.
- BIPOC – black, indigenous, and people of color
- EJSCREEN Vulnerability Index Percentile – an index value showing the relative risk of vulnerability to environmental hazards. For more information, visit the EPA’s EJSCREEN resource.
- Energy Affordability Gap – annual energy expenditures beyond the 6% of annual income affordability threshold.